Live Listings Report

What is the Top 500 Live Listings Report about?

The Top 500 Live Listings Report is literally a list of the top 500 ranked product listings for any search query according to eBay’s search and sort algorithm called Best Match.

Best Match is an important part of selling on eBay.

eBay monitors buyer behaviour and preferences to assess and predict a product listing’s relevance and desirability for purchase. When a buyer searches for a product, all product listings are brought together and ranked in order of the most relevant and most likely to make a sale at the top of the search results from #1 onward.

The fact that most eBay purchases occur within the first page of Search Results (the top 50 product listings) suggests that Best Match is a pretty smart algorithm for predicting, and suggesting, the right product match for that online shopper.

Seasoned eBay sellers know how critical it is to monitor their listings’ rank and work towards securing the top of the search results page in order to achieve sales momentum.

The Top 500 Live Listings Report is designed to help eBay Sellers understand what eBay’s AI powered algorithm thinks are in-demand products for a particular search term, category or seller.  

By running a Top 500 Live Listings Report for a search term, category or seller, you will be able to analyse the share of search results. Identify dominant competitors, products and product features or brands.

Use the filters to isolate the data to the top 50 and watch product prices zoom into a range that has the most buyer interest. The top 50 represents page 1 of search results where most sales are actually made.

By working with the report, you could spot emerging trends in buyer behaviour.  Compare competing products and uncover how customers are choosing one over the other.


Explore the data and see where it takes you.

<Return back to Help

Top 500 Live Listings Report Glossary

The Top 500 Live Listings report is a live market report for eBay’s top 500 Best Match listings for any keyword or category. This report is great for insight into how eBay is merchandising products at what price points to buyers right now. Assess seller and brand dominance of search results. Spot trending product features as ranked by Best Match.

Below is a quick walk through and glossary for the metrics provided in the Top 500 Live Listings report.

FAQ_Top 500_Glossary.png

Overview Boxes

Overview boxes give a summary of the data set. The definitions of each metric are:

  • Listings: A count of listings within the data set.  In this report there will be a maximum of 500.

  • Total Search Results: Total number of listings that could be relevant to your search, of which for this report, we only present the top 500.

  • Price Range: The range of prices being offered within the 500 listings.

  • Postage Range: The range of Postage/Shipping costs being offered within the 500 listings.

  • Quantity: Total current stock levels for the 500 listings.

  • Sellers: Number of sellers that the 500 listings belong to.

  • Brands: Number of brands being offered within the 500 listings.

  • Sold: The number of items sold over the entire lifetime of the listings, from listing start date to present, for the 500 listings. This sold number resets to zero if the listing is ended and relisted.


Data Tables

Data is presented in an easy to use tabular format with 3 distinct data view options:

  1. Seller view

  2. Brand view, and

  3. Listings view. 

Click the headers of the data tables to sort. The data column definitions are:

  • Seller: The seller’s eBay ID

  • Listings: Number of listings.

  • Top Rank: Highest ranked listing. This is the default sort for this report.

  • Qty: Quantity of stock available.

  • Sold: The number of items sold over the entire lifetime of the listings, from listing start date to present, for the 500 listings. This sold number resets to zero if the listing is ended and relisted.

  • Med Price: The median price. The price that falls in the middle of the range for that seller or brand.

  • Med Postage: The median postage cost. The postage cost that falls in the middle of the range for that seller or brand.

  • Brands: A snapshot of the brands on offer from the Seller.


Charts

To access the charts, click on the chart icon located at the top right of the data tables. 

In the Live Listings Report there the following charts:

  1. Box plot charts for price and postage to show the distribution of listings across the ranges.

  2. Donut charts with drop down options to visualise comparative dominance.

Charts.png

Why doesn't your Best Match rank listings match the eBay website?

It should reflect almost exactly. Rank order is given to us directly from eBay.  It reflects the view that a domestic buyer from that country will see. We have calibrated ShelfTrend’s Top 500 Live Listings Report to match at least 90% of what is on the eBay website. However there can be some discrepancies - here are some possible reasons why:

  1. Your data report may need to be refreshed. Rank can change pretty frequently, especially in fast moving categories.  eBay is constantly shuffling product listings so when you click “Run Report,” the rank is reflective of when you ran the report. Check the day and time for when you ran the report to ensure you have the most recent data.

  2. Promoted Listings are excluded from ShelfTrend’s Top 500 Live Listings report. Promoted listings are not ranked but paid seller ads that are intermingled and made to look like a listing. Depending on which country you are in, the number of promoted listings can appear to push out rank numbers.

  3. You are not in the same country as the marketplace you are researching. Your eBay experience is greatly influenced by your geolocation and your registered shipping address. You need to reflect the profile of a domestic buyer to get the true listing rank that eBay intends.

  4. Some countries like Canada and other smaller European countries supplement a lack of domestic inventory with listings from other countries that will ship to their location. Intermingling listings that will ship to that host country, or will ship “Worldwide” can impact your view of Best Match rank.


How do I understand the price or postage range charts?

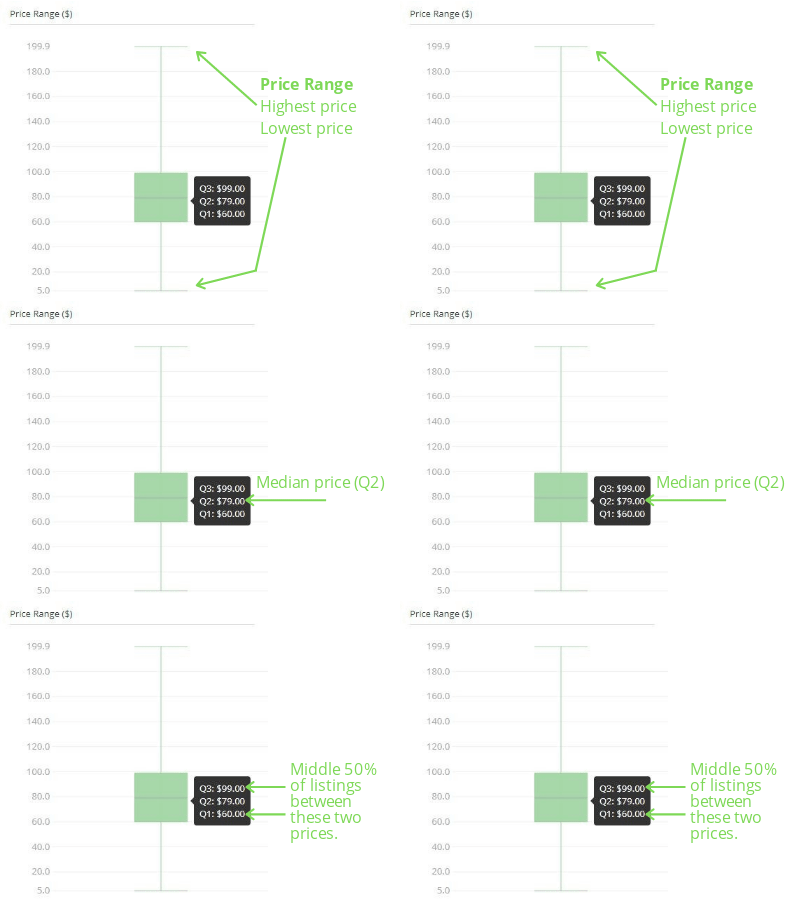
Box Plot.gif

The postage and price ranges are presented using box plots. This type of graph can show that although a price range may be very wide, the price of most listings may be concentrated in a much narrower band.

The vertical axis of the box plot presents the highest and lowest prices within the range. The horizontal line is the median price (Q2) within the range.

The green box above the horizontal line represents 25% of listings above the median price. The green box below the horizontal line represents 25% of listings below the median price.

As the graph splits the number of listings into 25% segments, it makes it quick to see exactly where 25%, 50% to 75% of all listings are priced against the 100%.


Why don’t sales on ShelfTrend match my eBay dashboard?

ShelfTrend’s reports show sales for listings that are highly ranked and currently live on the site. ShelfTrend does not present sales for ended listings.

Top 500 Live Listings Report shows the life time sales of a listing for up to the top 500 Best Match ranked listings.

Listings that fall below rank may not make it into your report. Modify your report criteria by keyword or category to capture those missing listings via a different angle.

For example, if your report criteria is: Top 500 Live Listings Report for “iPhone covers” but your high end leather iPhone case falls outside of rank, then in your next report, use more specific keywords such as “Leather ïPhone case” or other descriptors.

Another option is that you can run ShelfTrend reports by Item ID. Select the report and the country, then enter the Item ID into the Keyword field.