
Compression Boot Summary of Research
Market size: The global recovery compression boots market reached $1.3B in 2024, projected to grow at 7-9% CAGR through 2033
E-commerce dominance: Online channels account for the largest sales share, driven by convenience and product discovery
Price segmentation: Clear three-tier market: Budget ($60-$200), Mid-range ($200-$500), Premium ($500-$1,500+)
Top opportunity: Budget-to-mid-range segment on Amazon shows strong demand with lower competition than premium tier
Key buyers: Marathon runners, CrossFit athletes, weekend warriors, rehabilitation patients, and standing-profession workers
Sourcing opportunity: China-based OEM manufacturers offer units at $35-$90 FOB, enabling 50-70% gross margins
Seasonal patterns: Peak demand June-August (summer fitness season) and November-December (holiday gifting)
Wireless trend: Cordless models commanding premium pricing and faster growth (15%+ YoY) versus tethered systems
Market leaders: Hyperice (Normatec) and Therabody dominate premium; budget space fragmented with opportunity
Entry barrier: Low MOQs (10-50 units) make test orders accessible for new sellers
1. Introduction
Defining the Category
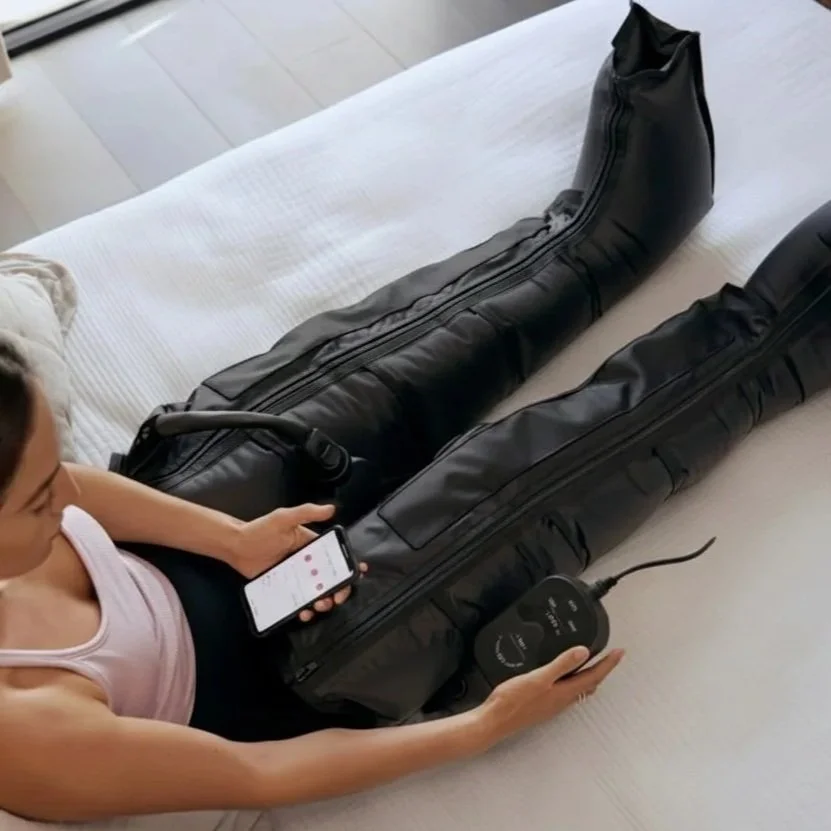
Recovery compression boots, also known as pneumatic compression boots or air compression leg massagers, are wearable devices that use sequential air pressure to massage the legs from foot to thigh. Originally developed for medical applications such as preventing deep vein thrombosis (DVT) and treating lymphedema, these devices have exploded into the athletic recovery and consumer wellness markets over the past decade.
The technology works by inflating air chambers in a controlled sequence, starting at the feet and moving upward. This creates a "milking" effect that promotes blood circulation, accelerates lymphatic drainage, and helps flush metabolic waste products like lactic acid from tired muscles. Sessions typically last 15-60 minutes and provide benefits similar to a professional sports massage.
Market Landscape and Product Evolution
The compression therapy market has undergone significant transformation since its clinical origins. What began as bulky, hospital-grade equipment has evolved into sleek, consumer-friendly devices that fit in gym bags and carry TSA approval for travel.
Key Historical Milestones:
1998: Normatec founded by a physician, establishing the category for athletic recovery
2011: LeBron James publicly endorses compression boots, sparking mainstream athlete adoption
2017: Hyperice acquires Normatec, accelerating innovation and marketing
2020-2021: COVID pandemic drives home fitness boom, expanding consumer market
2023-2024: Wireless designs (Therabody JetBoots, Normatec Elite) eliminate external pumps
2025: Nike/Hyperice Hyperboot introduces wearable compression in shoe form factor
The market has grown from a niche medical device category to a $1.3 billion global industry in 2024, with projections suggesting it could reach $2.5-$2.9 billion by 2033-2035.
Product Segments, Price Ranges, and Popular Brands
Premium Segment ($500-$1,549)
This tier is dominated by two major players who invest heavily in R&D, marketing, and professional athlete partnerships:
Hyperice Normatec 3 ($799): The gold standard with 7 compression levels, Bluetooth app connectivity, 2+ hour battery, patented Pulse technology
Hyperice Normatec Elite ($1,199): Wireless evolution with integrated pumps, 4-hour battery, no external hoses
Therabody RecoveryAir PRO ($1,299): Continuous pressure customization (20-100 mmHg), zone targeting, 90-minute sessions
Therabody JetBoots ($599-$799): Integrated wireless design, TruGrade technology, 4 chambers
Mid-Range Segment ($200-$500)
This growing segment bridges professional-grade features with consumer-accessible pricing:
QUINEAR QN-090A ($350-$400): 12 intensity levels, 2500mAh battery, smart sensors, FSA/HSA eligible
Rapid Reboot REGEN ($495): 20 compression levels, 4 massage patterns, app connectivity
FIT KING Pro Series ($300-$460): 4-chamber full leg coverage, 8 pressure intensities, cordless options
PULSIO ($299): Up to 200mmHg pressure, 8 modes, popular with UK marathon runners
Budget Segment ($60-$200)
The entry point for casual users and price-conscious buyers testing the category:
FIT KING FT-082A ($129-$169): 4 airbag chambers, 8 pressure settings, plug-in operation
RENPHO Leg Massager ($90-$170): 6 massage modes, optional heat, velcro adjustable fit
Sharper Image Flex ($130-$150): Sold at Costco/Walmart, 5 modes, 5 intensity levels
FitRx RecoverMax ($98-$150): Available at Walmart, heated option, travel case included
CINCOM/ALLJOY ($45-$80): Entry-level calf-focused massagers
Private Label Opportunity
The fragmented budget segment presents significant opportunity for sellers to develop branded products. Many successful Amazon sellers source similar products from the same Chinese manufacturers (Konbest, Senyang, Healthpal) who supply "name brand" budget options.
Sourcing Economics and Cost Analysis
Understanding the true landed cost is essential for sellers evaluating this opportunity. The following table provides a comprehensive breakdown for different product tiers, based on current Alibaba/Made-in-China pricing and standard import assumptions.
Landed Cost Calculator: Recovery Compression Boots
Budget Tier (4-Chamber)
| Cost Component | Amount |
|---|---|
| FOB China Price | $35-$50 |
| Sample Order (2-10 units) | $45-$65/unit |
| Test Order MOQ | 10-50 units |
| Volume Order MOQ | 200-500 units |
| Sea Freight (per unit) | $4-$6 |
| Air Freight (per unit) | $12-$18 |
| US Customs Duty (3-5%) | $1.50-$3 |
| Customs Brokerage | $0.50-$1 |
| Inspection/QC | $0.50-$1 |
| Insurance (0.5%) | $0.20-$0.30 |
| Packaging/Branding | $2-$4 |
| Landed Cost (Sea) | $44-$66 |
| Landed Cost (Air) | $52-$78 |
| Retail Price | $129-$199 |
| Gross Margin | 55-67% |
| Amazon FBA Fees | $25-$35 |
| Net Margin After FBA | 35-50% |
Mid-Range Tier (6-Chamber)
| Cost Component | Amount |
|---|---|
| FOB China Price | $55-$85 |
| Sample Order (2-10 units) | $70-$100/unit |
| Test Order MOQ | 50-100 units |
| Volume Order MOQ | 300-500 units |
| Sea Freight (per unit) | $5-$8 |
| Air Freight (per unit) | $15-$22 |
| US Customs Duty (3-5%) | $2.50-$4.50 |
| Customs Brokerage | $0.50-$1 |
| Inspection/QC | $0.75-$1.25 |
| Insurance (0.5%) | $0.30-$0.45 |
| Packaging/Branding | $3-$5 |
| Landed Cost (Sea) | $67-$105 |
| Landed Cost (Air) | $77-$117 |
| Retail Price | $249-$399 |
| Gross Margin | 58-73% |
| Amazon FBA Fees | $35-$50 |
| Net Margin After FBA | 40-55% |
Premium Tier (8-Chamber Wireless)
| Cost Component | Amount |
|---|---|
| FOB China Price | $85-$130 |
| Sample Order (2-10 units) | $100-$150/unit |
| Test Order MOQ | 100-200 units |
| Volume Order MOQ | 500-1000 units |
| Sea Freight (per unit) | $6-$10 |
| Air Freight (per unit) | $18-$28 |
| US Customs Duty (3-5%) | $4-$7 |
| Customs Brokerage | $0.50-$1 |
| Inspection/QC | $1-$2 |
| Insurance (0.5%) | $0.45-$0.70 |
| Packaging/Branding | $4-$7 |
| Landed Cost (Sea) | $102-$158 |
| Landed Cost (Air) | $114-$176 |
| Retail Price | $449-$699 |
| Gross Margin | 60-75% |
| Amazon FBA Fees | $45-$65 |
| Net Margin After FBA | 45-58% |
2. Marketplace Sales Opportunity Analysis
Opportunity Score Legend
Score measures selling success potential based on buyer demand vs seller competition. Higher = better opportunity.
| Marketplace | Opportunity Score | Product Segment | Est. Weekly Unit Sales | Est. Weekly Revenue | Avg. Price Range | Est. Profit Margin |
|---|---|---|---|---|---|---|
| Amazon US | 8 | Mid-Range ($200-$400) | 2,500-4,000 | $625K-$1.2M | $249-$399 | 40-55% |
| 6 | Budget ($60-$200) | 4,000-6,500 | $400K-$780K | $89-$169 | 35-45% | |
| 4 | Premium ($500+) | 800-1,500 | $560K-$1.5M | $599-$1,299 | 50-65% | |
| eBay | 7 | Refurbished Premium | 300-600 | $150K-$360K | $400-$650 | 45-55% |
| 5 | New Budget-Mid | 500-900 | $75K-$180K | $120-$250 | 30-40% | |
| Walmart | 7 | Budget ($80-$200) | 1,200-2,000 | $144K-$300K | $98-$169 | 35-45% |
| 6 | Mid-Range ($200-$500) | 400-800 | $120K-$280K | $249-$459 | 38-48% | |
| Shopify DTC | 7 | Branded Premium | 150-400 | $90K-$320K | $449-$799 | 55-70% |
| 5 | Branded Mid-Range | 200-500 | $50K-$150K | $199-$349 | 50-60% | |
| Target (Online) | 6 | Wellness Category | 200-400 | $30K-$68K | $129-$199 | 30-40% |
| 4 | Premium Fitness | 50-150 | $30K-$112K | $499-$799 | 35-45% | |
| Costco | 7 | Value Bundle | 800-1,500 | $104K-$225K | $129-$159 | 25-35% |
| TikTok Shop | 9 | Viral Budget Products | 500-2,000 | $50K-$200K | $79-$149 | 40-55% |
| B2B/Wholesale | 6 | Clinic/Gym Supply | 100-300 units | $40K-$150K | $350-$600 | 20-30% |
Data Notes and Confidence Levels
- Amazon estimates: Based on category analysis and third-party tools. Confidence: Medium-High
- Walmart/Target: Extrapolated from public listings and market share data. Confidence: Medium
- eBay: Based on sold listings analysis and category trends. Confidence: Medium
- Shopify DTC: Industry benchmarks for health/wellness brands. Confidence: Medium-Low
- TikTok Shop: Emerging channel with high variability. Confidence: Low-Medium
- Profit margins: Assume standard fulfillment costs; exclude advertising spend.
- Weekly sales: Category-wide estimates across all sellers; individual results vary significantly.
The analysis reveals that Amazon's mid-range segment ($200-$400) offers the strongest opportunity score due to high search volume combined with manageable competition. The budget segment on Walmart presents an emerging opportunity as the retailer expands its recovery category.
Key marketplace insights:
Amazon (Dominant Channel)
Highest search volume and buyer intent
Established brands command premium positioning
Budget segment fragmented with hundreds of sellers
FSA/HSA eligibility drives Q4 sales spikes
Private label success stories in $150-$300 range
eBay (Secondary Channel)
Strong for refurbished/open-box premium units
Price-sensitive buyers seeking deals
Less competition than Amazon
Good for liquidating overstock
Walmart (Growth Channel)
Rapid category expansion
FitRx brand exclusive showing success
Lower seller competition vs Amazon
Marketplace seller program growing
Shopify/DTC (Brand Building)
Higher margins without marketplace fees
Requires significant marketing investment
Best for differentiated/premium positioning
Growing subscription model opportunity
3. Buyer Demand and Keyword Trends Analysis
Main Buyer Personas
1. Competitive Athletes (25% of market)
These buyers prioritize performance recovery and are willing to invest in premium equipment. They include marathon runners, triathletes, CrossFit competitors, and team sport athletes.
What they value:
Scientific validation and clinical studies
Multiple compression levels (7+)
Full-leg coverage including thighs
Durability for daily use
Bluetooth app connectivity for tracking
Professional athlete endorsements
Search behavior:
"Normatec recovery boots"
"Best compression boots for runners"
"Compression therapy for marathon training"
"Leg recovery after marathon"
2. Fitness Enthusiasts (35% of market)
Regular gym-goers and recreational athletes who exercise 3-5 times weekly. They want effective recovery without breaking the bank.
What they value:
Good value for money
Easy to use at home
Multiple massage modes
Heat therapy options
Portable for travel
Strong Amazon reviews
Search behavior:
"Leg compression massager for circulation"
"Recovery boots for sore legs"
"Air compression leg massager"
"Best leg massager after workout"
3. Medical/Rehabilitation Patients (20% of market)
Individuals with circulation issues, lymphedema, DVT prevention needs, or post-surgical recovery requirements.
What they value:
FSA/HSA eligibility
FDA clearance/medical-grade quality
Sequential compression for circulation
Doctor recommendations
Easy controls for elderly users
Customer support/warranty
Search behavior:
"Leg massager for circulation problems"
"DVT prevention compression boots"
"Lymphedema leg massager"
"FSA eligible leg massager"
4. Standing-Profession Workers (15% of market)
Nurses, retail workers, chefs, teachers, and others who spend long hours on their feet.
What they value:
Immediate relief for tired legs
Compact storage
Quiet operation
Affordable price point
Simple setup and use
Heat therapy for relaxation
Search behavior:
"Leg massager for nurses"
"Standing all day leg pain relief"
"Tired legs massager"
"Compression boots for swollen feet"
5. Wellness/Self-Care Consumers (5% of market)
General consumers interested in at-home spa experiences and biohacking trends.
What they value:
Sleek design/aesthetics
Social media presence/influencer endorsements
Multi-use (arms, hips attachments)
Premium unboxing experience
Sustainability/eco-consciousness
Search behavior:
"At home leg massage machine"
"Recovery tools for wellness"
"Compression therapy at home"
"Leg spa machine"
Google Trends and Search Volume Data
Based on available search data, the compression boots category shows consistent growth with notable seasonal patterns:
Primary Keywords (Monthly Search Volume Estimates):
"Leg massager" - 90,000-120,000 searches
"Compression boots" - 18,000-25,000 searches
"Leg compression massager" - 8,000-12,000 searches
"Normatec boots" - 6,000-9,000 searches
"Recovery boots" - 5,000-8,000 searches
"Air compression leg massager" - 4,000-6,000 searches
"Therabody compression boots" - 2,000-3,500 searches
Trending/Rising Queries:
"Wireless compression boots" (+45% YoY)
"Compression boots for runners" (+35% YoY)
"FSA eligible leg massager" (+60% YoY)
"Portable recovery boots" (+40% YoY)
"Compression boots vs massage gun" (+25% YoY)
Seasonal Patterns:
Peak Season 1 (June-August): Summer marathon training, outdoor fitness activity increases demand by 25-35%
Peak Season 2 (November-December): Holiday gifting and Black Friday/Cyber Monday deals drive 40-50% of annual sales for some sellers
Shoulder Season (January-February): New Year fitness resolutions create secondary demand bump
Quiet Period (March-May, September-October): Opportunity for inventory building and product launches
Community Feedback and Product Improvement Opportunities
Analysis of Reddit discussions, Amazon reviews, and fitness forums reveals common pain points and desired improvements:
Frequently Cited Issues:
Sizing problems: Many boots don't accommodate larger thighs (30"+ circumference) or shorter users (under 5'4"). Opportunity for extended sizing options.
Portability concerns: External control boxes are bulky and inconvenient for travel. Wireless designs command premiums specifically addressing this pain point.
Noise levels: Pump noise during operation disturbs TV watching or relaxation. Quieter compressors are a differentiator.
Foot compression: Some budget models squeeze feet uncomfortably rather than sequentially. Proper foot chamber design matters.
Battery life: Users want 3+ hours for full sessions without recharging. Sub-2-hour battery life is a dealbreaker.
Durability: Air chamber leaks and zipper failures are common complaints on budget models. Quality materials justify price premium.
Upper thigh coverage: Many boots stop at mid-thigh, leaving hip flexors untreated. Full thigh-to-foot coverage is valued.
Requested Features:
App connectivity with customizable programs
Heat therapy integration (highly requested)
Zone targeting for specific muscle groups
Faster inflation cycles for quicker sessions
Machine-washable liners for hygiene
Attachment options for arms and hips
Sources and References
Verified Market Reports - Air Compression Recovery Boots Market Size, Trends, Industry Outlook & Forecast (April 2025)
Metatech Insights - Air Compression Recovery Boots Market Size & Share 2025-2035 (March 2025)
Virtue Market Research - Compression Boots Market Size, Share, Growth 2025-2030
Business Research Insights - Compression Recovery Systems Market Report 2025-2033
Accio Business Intelligence - Compression Boots Trends 2025: Innovation & Recovery
Men's Health Fitness - Best Compression Boots Reviews (December 2025)
Garage Gym Reviews - The 5 Best Compression Boots 2025
Runner's World UK - Best Compression Boots for Recovery (November 2025)
Good Housekeeping - Trainers Recommend These Compression Boots (September 2025)
Alibaba.com and Made-in-China.com - OEM Manufacturer Listings and Pricing (December 2025)
This analysis was prepared for e-commerce sellers and marketplace entrepreneurs evaluating the recovery compression boots category. Data reflects publicly available market research, platform listings, and manufacturer information as of December 2025. Sellers should conduct additional due diligence before making sourcing or inventory decisions.