
It seems like a dream – eager buyers knocking down the doors of the marketplace looking to spend money, BUT there is either no inventory or, there isn’t the right selection of products.
With over 170 Million online shoppers on eBay at any given time, and tens of thousands of product categories, you’d be amazed at how frequently this perfect scenario actually arises. But how do to spot these opportunities?
This guide walks you through how you can peer through eBay’s marketplace in search for opportunity and land on something that could be interesting for your next business venture.
If you’re starting fresh without any product in mind, identifying something from nothing is the hardest part in the process. If this is you - start with what you know. Sell something you’re familiar with and passionate about. This will fast track your product knowledge and judgement of a good product.
If you already have a product or two in mind – excellent. Let’s assess the market and build some proof points that there IS an opportunity market of eager buyers to be had.
The best way to prove a market is to benchmark it against another.
Let’s take a read of a handful of known markets on eBay Australia that is consistently in demand. At the time of writing this article, the top 1000 listings for the mobile phone case, covers & skins market were selling 11,067.26 units a week at an average of AU$10.59 per unit. Whereas, mobile phone holders & mounts were selling 5409 units a week at an average of AU$14.11 per unit.
Just from this data alone, you can see that phone cases, covers and skins are selling 2x faster than that of holders and mounts. Mind you, cases and covers are AU$3.52 cheaper than holders and mounts, but in the whole scheme of things, the sales velocity is fast enough that you would turn over much more revenue selling cases than you would holders.
Now let’s take a read of a few other product areas you were thinking of getting into. In the table 1.1 we compare Mobile phone cases to holders and mounts against:
Cat toys,
Dog toys,
Vitamins & Minerals (for humans) and.
Lego building toys.
As you can see, nothing compares to the sales velocity of mobile phone accessories - they’re a fast moving commodity these days. But all things considered, Cat toys and even Vitamins & minerals are an interesting proposition - especially if you are already interested in those areas.
Start building your own benchmarking table. Run a few Average Weekly Sales reports on ShelfTrend to compare numbers. While you’re at it, here are a few other metrics you will find in the Average Weekly Sales report that you should take note of:
1. How many sellers are active in that market? Is it dominated by only a few players or are there a lot of little guys trying to have a go?
2. How many brands are being sold? Does it seem that buyers prefer the one brand? Or are there other alternatives that are being offered? How are they fairing against the big brand?
Explore the data so that you can draw conclusions on buyer preferences toward certain products, product features, price points, or brands that are selling better compared to others.
Examine the inventory range to identify supply gaps with proven sales.
Now that you’ve isolated a product category where there seems to be sufficient buyer interest on eBay, let’s look through the available inventory data to understand the current product range, pricing and any indication of supply gaps that could present an opportunity.
To better explain this section, let’s stay with the Cat Toys category. Run a Supply Demand report with the category selection of Cat Toys for eBay Australia (see image 1.1.)
The Supply Demand report takes the top ranked 1000 listings on eBay - which is the first 20 pages of default eBay search results (without Promoted/Sponsored listings) - and orders listings that are selling fastest.
In the example with Cat Toys, we see that in the top 10, there are -
5 are laser pointers at various price points (AU$4.32-$12.95). Together, these 5 listings are moving about 207.76 units a week.
3 are an electric wagging fish - similar price points (AU$13.95-$16.83). Together, these 3 listings are moving 122.45 units a week.
1 LED ball at AU$6, selling 18.2 units a week, and
a motorized ball with tail AU$13.65 selling 15.4 units a week.
Let’s think about these numbers for a second.
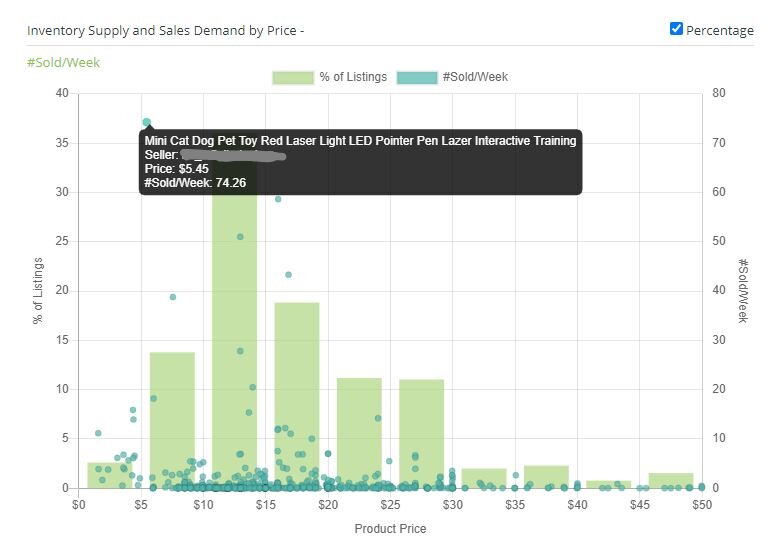
Clearly laser pointers are in high demand. The AU$5.45 laser pointer is the bestselling at 74.25 units a week. But the second fastest selling is AU$12.95, selling 51 units a week. This means that the cheaper laser pointer is selling 1.45x faster, but that second laser pointer is almost 2.4x the price. BUT, at the end of the week, who’s made more money?
The AU$12.95 laser pointer is making $606.65/week, whereas
AU$5.45 laser pointer is making $404.72/week.
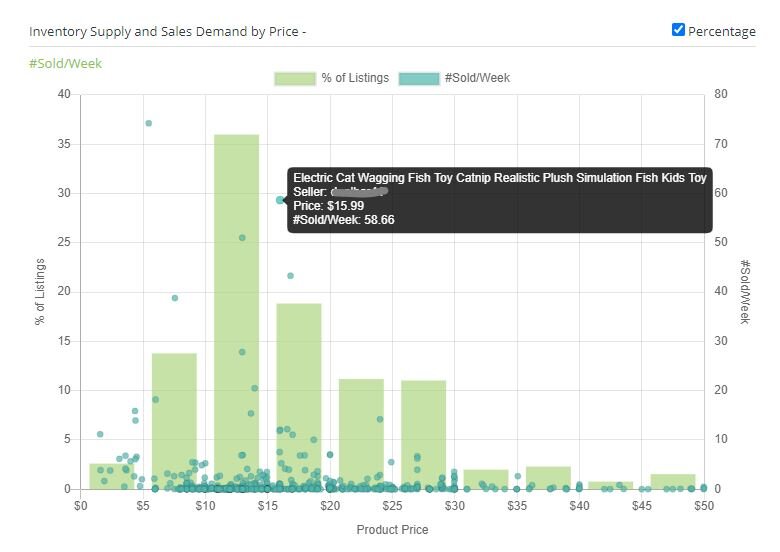
The electric wagging fish seems to be a bit of a red-herring, However, at those price points those 3 listing are making more than the laser pointers!
AU$15.99 fish is selling 58.66 units a week and making, AU$937.96/week,
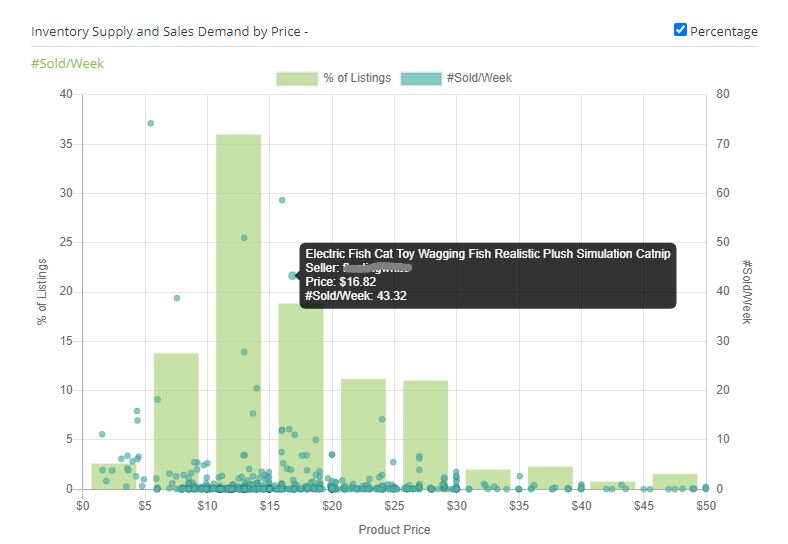
AU$16.82 fish is selling 43.32 units a week and making, AU$728.61/week, and
the AU$13.95 fish is selling 20.48 units a week and making, AU$285.62/week.
Looks like the higher price points are doing pretty good in this product category.
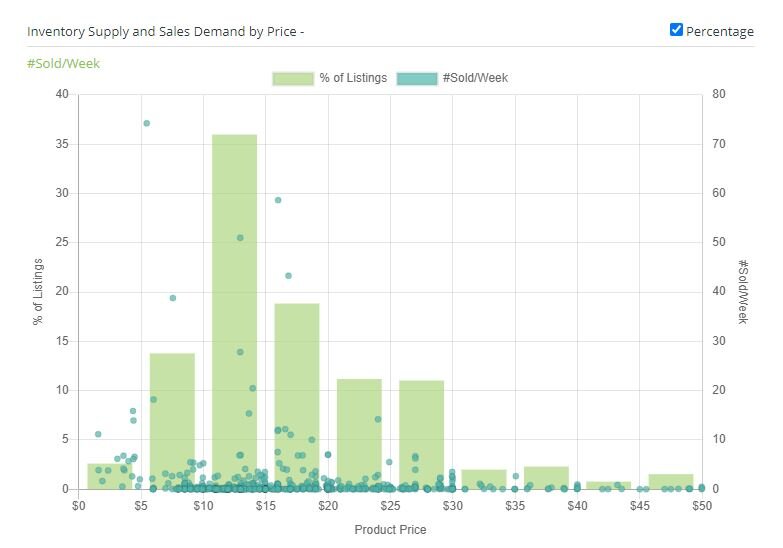
Click through to the graphs.
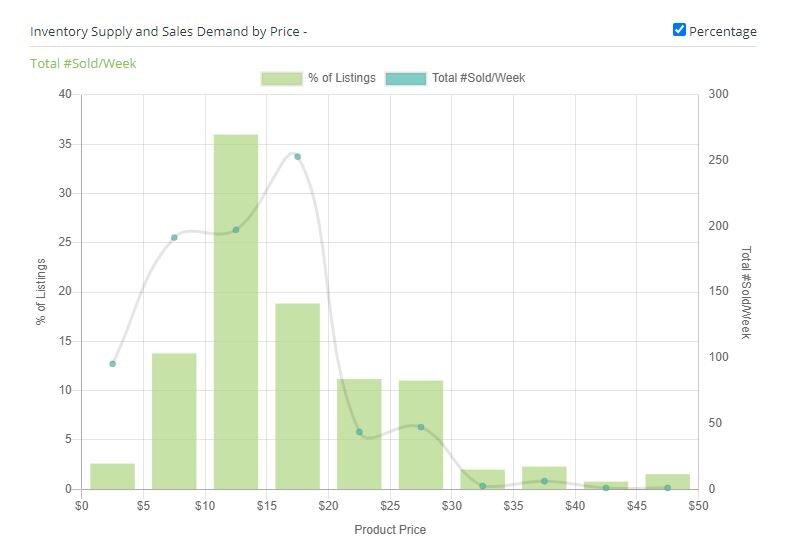
Looking at Image 3.1 below, across the horizontal axis is the price distribution. The green bars represent the listings currently being merchandised to the buyer. As you can see in the first image, most listings (35.99% precisely) are between AU$10-$15. The second tallest bar is between AU$15-$20 at 18.84% of the listings.
The blue dots are the #Sold/week by listing, also distributed across the price axis. The higher up the dot, the more sales it is achieving. You can already see that there are a handful of dots that really stand out in terms of their sales velocity. Hover over each dot for details of the listing - see images 3.2 to 3.4. Click on the details to go to the listing on eBay.
Image 3.5 shows the total #Sold/week by price range. This is where it gets really interesting. As dots you can see outliers, but as a total, you can see which price range is outperforming the others. In this view, you see that the price range between AU$15-$20 is actually performing the best AND yet, it is also the price range with only 20% of listing supply. This is what opportunity of a potential supply gap with proven sales looks like.
So what is next? Fill that gap.
Time to source product that can fill that gap or lure that cat-owner who is willing to shop in that price bracket.
Spend some time looking through the Cat Toy category between the AU$15-$20 price range. What differentiates a product across the price ranges - is it quality, type of materials, a stand out product feature? There are sales that prove that this price range is well within the reach of Cat pet owners.
Look at other price ranges to find opportunities. Are there missing product types or brands in the price range you’re looking to sell into? Are there Cat Toys in the AU$20-$25 range that could be overpriced but could see an acceleration of sales should the price be brought down a notch?
These are some questions you might think through as you explore the data further and as you make contact with your sourcing agent.
Opportunity on eBay is everywhere, its whether you can find them and take advantage of them. Best of luck.